
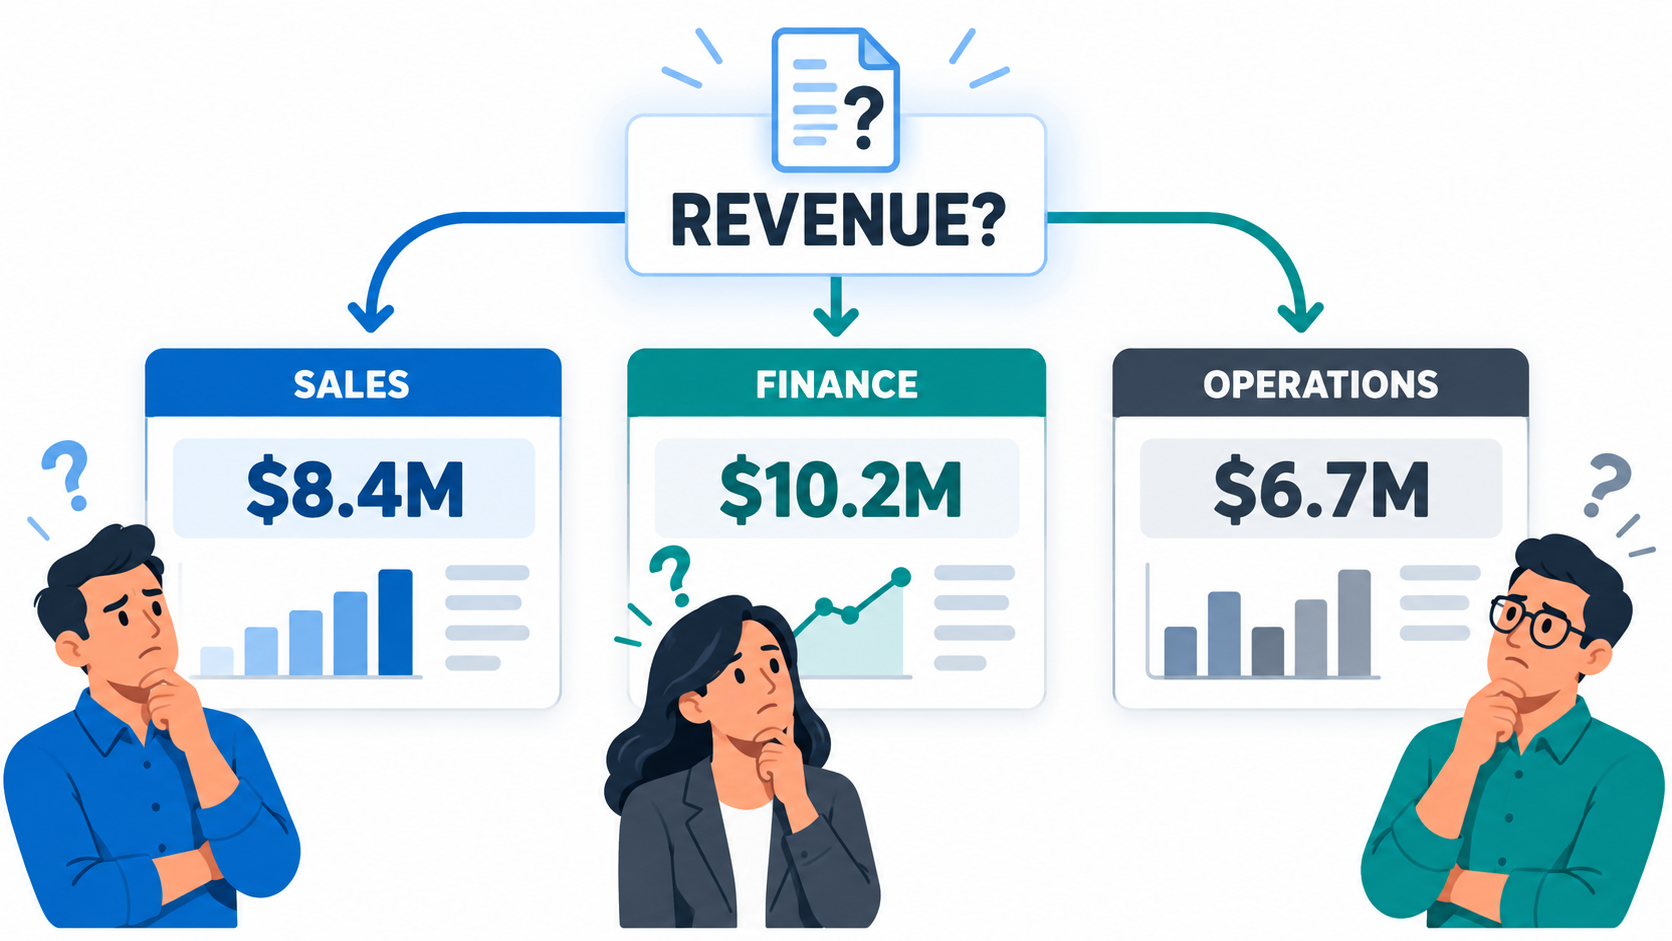
A dashboard can make information easier to see. It cannot decide what the information means.
When leaders disagree with a report, the immediate request is often to change the dashboard. Sometimes the presentation is the problem. Often the disagreement began much earlier, with an undefined measure, inconsistent source data, or a business rule that exists only in someone’s memory.
The visualization is the last step. The measure comes first.
A familiar label can hide several definitions
Terms such as revenue, active customer, churn, renewal, pipeline, utilization, and margin sound precise. Inside an organization, they may have several reasonable meanings.
An active customer might mean a customer with a current contract, an enabled account, recent usage, an unpaid invoice, or revenue recorded during the period. Each definition could be useful. They do not produce the same number.
The dashboard cannot resolve that disagreement by selecting a field and applying a formula. The organization must decide which question the measure is intended to answer.
Define the measure in business language
A useful definition should be understandable without reading the report logic.
For each important measure, record:
- The business question it answers
- What is included
- What is excluded
- The period or effective date used
- The event that causes an item to enter or leave the measure
- The system responsible for each required fact
- The person or role responsible for approving the definition
If the definition requires a paragraph, that is not automatically a problem. Important measures are often more complicated than their labels suggest. The problem is allowing the complexity to remain hidden.
Decide which event counts
Many reporting disagreements are timing disagreements.
Should a sale count when the agreement is signed, when service begins, when an invoice is issued, when cash is received, or when revenue is recognized? Those events may occur on different dates and live in different systems.
The correct answer depends on the purpose of the measure. A sales activity report and a financial statement do not need to use the same event. They do need to make their differences explicit.
Protect the source of each fact
A report may combine information from customer, contract, billing, accounting, and planning systems. Calling the result a “single source of truth” does not make every source equally authoritative.
Decide which system is responsible for each fact. The customer system may own an account relationship. The contract system may own approved terms. The billing system may own charges. The accounting system may own posted financial results.
When two systems disagree, the organization needs a correction path, not a formula that quietly chooses one.
Make corrections visible
Reliable reporting is not reporting that never changes. Business information changes because corrections, late events, reversals, and approved adjustments occur.
The important questions are:
- Who can correct the source?
- What evidence supports the correction?
- Will the report restate an earlier period or show the change in the current period?
- Can someone explain why the number changed?
A dashboard that updates without preserving that context may be current without being trustworthy.
Assign ownership for the definition
Technology teams can implement a measure. They should not be expected to invent the business decision behind it.
Someone with appropriate business authority must approve the definition and resolve conflicts. Systems professionals can help identify dependencies, test the logic, and show the consequences of different choices. The final meaning belongs to the business.
Test with records people recognize
Before relying on a total, test individual examples. Choose normal transactions, boundary cases, corrections, and exceptions. Ask the people closest to the work what they expect each record to do and why.
This is not a substitute for full testing. It is a practical way to expose differences between the written definition and the way the work actually occurs.
Build the dashboard after the measure is stable
Once the question, definition, ownership, sources, timing, and correction rules are clear, the dashboard becomes much easier to design.
The visual should help the reader notice what requires attention. It should not force the reader to reverse-engineer the calculation or guess why two reports disagree.
A beautiful dashboard can make a weak measure look authoritative. A trustworthy dashboard begins by making the measure explainable.